

I am usually met with strong scepticism when I talk to seasoned survey researchers about my work using primarily mobile SMS demand-side surveys for nationally representative indicator measurement. This kind of work has traditionally been done using probability sampled face-to-face interviews. Given their limits in terms of what and how questions can be asked and who they can actually reach, it seems almost inconceivable that research could work using SMS surveys.
When I tell people how promising the results are, they are still uncomfortable. It is such a strong departure from what researchers are accustomed to.
Discomfort with things that are new or different is natural, we experience this throughout our lives. I recently went snowboarding for the first time in my life. I was born and raised in Johannesburg, South Africa so not only was this my first time snowboarding, but it was actually the first time I had ever seen snow. It was a real step out of my comfort zone. As always, trying something new was terrifying and I was filled with apprehension; would I hurt myself? Could I do this? Should I just go home? But once I started, all those fears flew away with the wind, it was an amazing experience and I am so glad I tried it.
Trying a new method of data collection, while it might not sound as fun as snowy mountain adventures, can be very similar. It is a new skill; things can go wrong and you need to be brave enough to learn how to do something different. Data collection using a new mode requires a completely new way of thinking about the survey design, the sample and how the data is analysed.
Conducting surveys via SMS has some intrinsic limitations. The questionnaire needs to be kept short; people can very easily drop out of the survey if they get bored. The questions themselves need to be no longer than 160 characters (including all answer options). And the questions need to be straightforward and easy to understand as we cannot rely on in person interviewers to explain anything.
Further, the sample is limited to those people who have access to mobile phones and are literate enough to take part. This means that if you want to represent everyone, some of the sample does need to be collected using a method that can reach those who are unable to take part in mobile surveys.
These design challenges could have been enough to put us off even trying, but we did try – and are very excited about the results we are seeing.
We set out to measure nine indicators of digital financial inclusion in eight different markets. In each of these markets there is an existing face-to-face survey that does just this. These surveys provided us the opportunity to test several different ways of mixing data collection modes and data modelling methods to find a low cost data collection method that replicates a face-to-face “gold standard”.
Unsurprisingly, we found that mobile surveys alone are not yet enough to provide sufficient representation – even with Bayesian modelling applied. However, the inclusion of even a very small face-to-face sample along with a large mobile sample into a Bayesian regression model provided for both accurate and precise results.
We used a multilevel regression and poststratification (MRP) approach to bring the different samples together and to account for the non-representativeness of this mix. MRP is widely used across the social sciences to adjust nonrepresentative data. It has two parts. First, a multilevel regression model is fit to the nonrepresentative data. The model is used to explain how variables such as region, age and gender are related to outcomes. Next, differences in the composition of the sample between the nonrepresentative data and the target population are accounted for using a procedure known as poststratification.
The below example shows the power of the mixed method along with MRP applied.
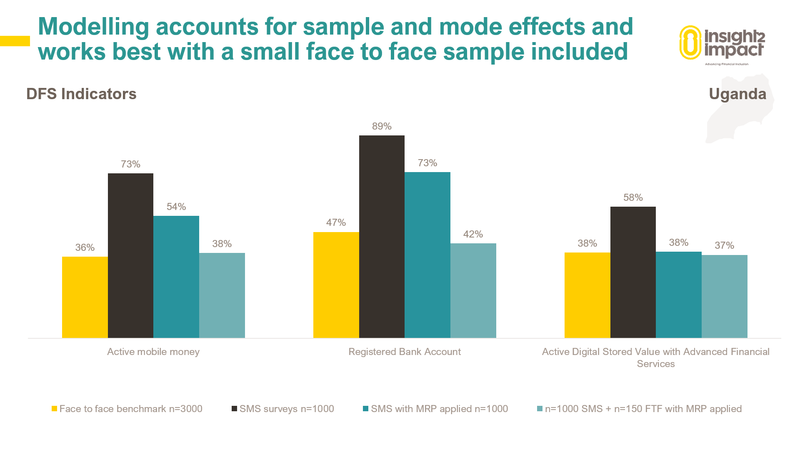
Using SMS alone in Uganda provided a sample with far greater digital financial inclusion than the face-to-face benchmark. Applying an MRP model to the SMS data does account for some of the sample skews but the inclusion of a small number of surveys collected face-to-face drastically improves the accuracy of the modelled results.
Getting to these results required us trying new things and approaching the survey and analysis very differently from how it has traditionally been done. However, using this method, we can reduce the cost of indicator measurement by up to 75%. This is a challenge worth pursuing, so why don’t you try something new today?