

Insight2impact has been exploring the analysis of financial transaction data to generate new insights on people’s financial behaviour. We have partnered with government institutions and commercial banks to analyse data in Mexico, Nigeria and Rwanda, and have learned a lot in the process on both the value of using this rich data and the challenges it poses as well.
Transaction data is notoriously hard to get, see this blog on our lessons learned around access. Time is one of the biggest challenges. We recently had to drop two projects from our portfolio because the process of data access has taken more than a year, and we are now out of time. But, in the places where we were able to build a trusting relationship with data providers, we were eventually granted access. Here are six things we learned that make the wait, well worth it.
A new approach can yield a different interpretation of people’s financial behaviour
1. P2P transfers are more than just remittances. Traditionally, person-to-person (P2P) payments within a country have been interpreted as internal remittances. That is, sending money to a relative or a friend, typically from someone working in an urban area to someone in a rural area. Although this narrative may hold true for certain groups, it is no longer the majority. When we analysed mobile money transaction data for senders and recipients in Rwanda, a different picture emerged. Most of the payments went to persons in the same town or geographic location. For example, in Kigali, almost 60% of both the number of P2P transfers and the value remained within the Kigali province. This leads to a new hypothesis: P2P is being used to make commercial payments for services, wages, loans and merchant payments.
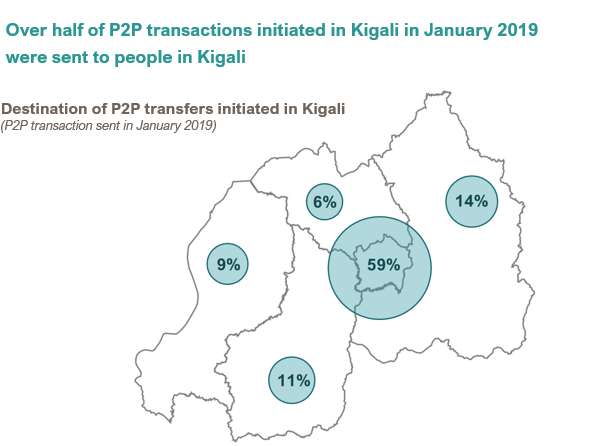
Mobile money has moved far deeper into the commercial space than previously thought, highlighting new policy implications. Policymakers in Rwanda might focus on the competitive implications of this insights, particularly on the cost of these transaction, and of course, there will be tax implications, since a significant portion of this may reflect
untraced revenue for businesses.
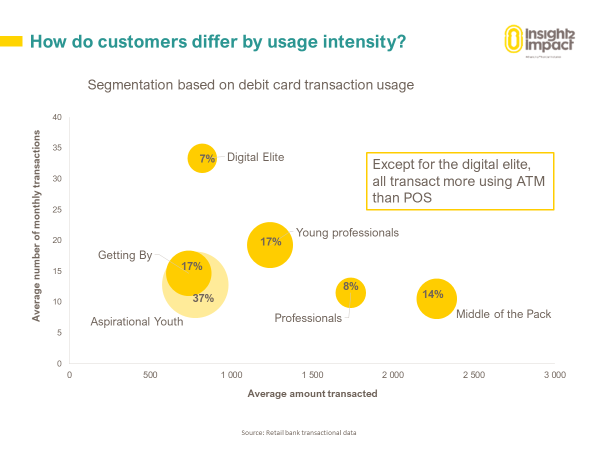
2. Segmentation for new insights. One of the most powerful and useful insights for our clients have come from the segmentation of the data. By clustering consumers by financial behaviours, such as typical values and number of payments made, and describing each segment’s demographics, a clearer picture emerges. This chart below shows the different usage patterns from a large retail bank in Mexico.
Aggregated numbers on financial inclusion can be misleading. Let’s take gender for example. A demographic segmentation using transaction data can provide more policy relevant insights when we can see that highly digitised users are mostly male and mostly living in the capital city, with low digital payment type diversity in other regions. This chart represents digital payments for one mobile money operator in Rwanda.
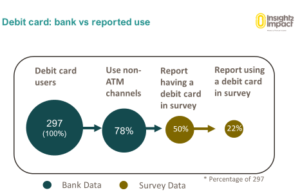
3. It can contradict survey data. We tried to link the transaction data to survey results for the same customers, and the result was a rather messy picture. Firstly, the linking process is arduous. Getting consumers to consent to linking their data or even finding the customers based on the contact details from the provider, is not straightforward. Secondly, what people say and what they actually do (based on real customer records) are two very different things. Although the sample size is small, a similar pattern was detected across countries and across different financial products. Of the 297 people with a debit card in the linked data set, we know from the transaction data that 78% made card payments, yet in the survey data only 22% reported doing so. Other research has documented how survey responses on financial service usage can differ significantly from transaction data (see this article) and there are many behavioural reasons why people tend to do this. Given this level of under-reporting, we learned that transaction data is more reliable for identifying which products and services people use and how frequently they use them.
However, survey data is better used to ask the questions that cannot be answered by transaction data, such as people’s financial needs and usage outside of the formal financial sector – for example when do they choose to use cash or to borrow from friends and family?
4. Context matters. Big data is extremely compelling, but without an understanding of the context, your insights may be off-track. What do you know about people’s financial needs in that area or country? Are digital payments options available, low cost, convenient and ubiquitous? Combining transaction data analysis with publicly available data, including surveys and administrative or GIS data available (see our data portal), can enrich the analysis and insights, making them more relevant for decision makers. For example, what are the norms in the country around spending choices and financial control? We needed to ask questions to check our biases and assumptions, and to be explicit about the limitations of the data, such as where only one financial service provider was analysed and who might have been excluded because they don’t have an account.
5. Be clear on the questions you want to answer. If the intention is for the insights to influence and be directly applicable for policy and regulation, there are two key learnings. Work with your client to identify the key policy questions that they want to answer. It sounds obvious, but the richness of the data can take you in many different directions if this isn’t made explicitly clear. Once the analysis begins, share early iterations of the findings and actively seek feedback – what do they find interesting or surprising? This will not only keep your analysis relevant but will continue to build trust. In our analysis of mobile money, once we began it was clear that fraud detection and over indebtedness were priorities for the regulator, so we were able to focus on that. We found in this case that 15% of digital loan subscribers were continuously borrowing and that over 70% were incurring late payment penalties during the analysis period. It’s worth remembering that there is very little value in unveiling an unexpected shock in your presentation, it will only leave your client feeling blindsided.
![]()
6. Create lasting change. The demonstration case of data analytics from transaction data for financial inclusion is extremely valuable, but it is only the first step. Lasting change is created by embedding the process internally for your client. Creating a realistic action plan to institutionalise data analytics will capitalise on the energy and political will generated from the insights. This requires three dimensions: people, technology and processes, including data management and governance. Hiring in new staff or recent data science graduates from African Institute for Mathematical Science (AIMS) or similar academic institutions can fill the immediate gap. Long-term vision will be needed here to make important decisions on the right fit approach for the business or institution.
Transaction data analysis for social good will likely become more and more relevant as the number of people with a digital footprint increases. Now is the time to skill up and get ready for that future.