

The MSME (Micro, Small and Medium Enterprise) sector is arguably the biggest employer in many economies, particularly in the developing world, and observed to be the biggest absorber for marginalised segments such as women, youth and poor communities. The broader problem, particularly in developing economies, is the large(r) proportion of informal enterprises that fall below the radar of formal regulation and compliance. This makes the sizing of the MSME sector a huge problem and has been coined by some researchers as a ‘grey sector’.
Various methodologies have been used in an attempt to size the MSMEs with little or inconclusive findings on the total contribution to economies, particularly contribution to GDP. What is clear is that the ratio of informal businesses far outnumbers the formal businesses. Past attempts in sizing the informal sector have largely relied on household sampling such as the second generation of FinScope MSME surveys (see the Eswatini MAP SME Roadmap 2018 report and Eswatini MAP SME Diagnostic 2018 Report), business census by statistics offices, and cluster sampling approaches. There have been significant improvements in sizing the informal businesses (and broadly the MSME sector) based on these, however still with considerable limitations.
Using improvements in technology and geospatial techniques, a new FinScope MSME sampling methodology based on the learnings from Lesotho (2015) and Eswatini (2017) FinScope MSME surveys was developed and first deployed in Malawi this year.
The thinking was simple. Not all enumeration areas (EAs) have the same probability to have commercial areas let alone MSMEs. Hence, FinMark Trust in collaboration with the National Statistics Office of Malawi and GeoTerraImage, used geospatial data modelling to improve the old methodology. This was to identify the EAs that possibly contain MSMEs, incorporating a number of datasets and spatial analysis techniques to allow for the most accurate results. The new approach achieved 2020 high confidence EAs (85%-100%), i.e. those EAs having the highest probability of having MSMEs across Malawi. Further classification of EAs into medium and low confidence were made (containing about 3 600 EAs) and sampled from to allow a representative sample of the whole of Malawi. Table 1 below shows the distribution of EAs by high confidence, and distribution of these EAs by region in Figure 1.
Table 1: Regional distribution of EAs with high probability to have MSMEs
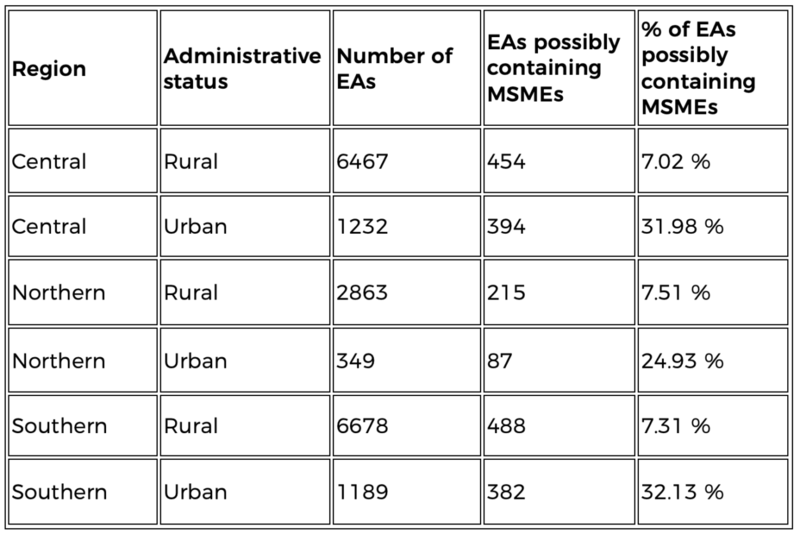
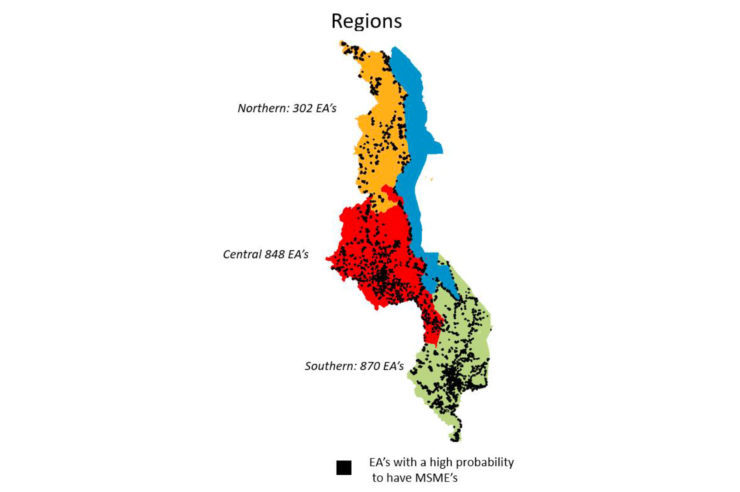
Figure 1: Regional distribution of EAs with high probability to have MSMEs.
With the approach detailed briefly above, the EAs identified from high, medium and low probability would then be sampled from. The sampling expert ensured representativeness across Malawi, as well as at regional and urban/rural levels.
Additionally, to improve the accuracy of the data and quality of the businesses surveyed, a comprehensive listing exercise was done for observed business units (such as shops, garages, salons, workshops, etc.) as well as households in the sampled EA. Hence, at each EA, a sampling frame (created from the listing made of business owners from the business units and households) was used to identify the business owners as being the ultimate sampling unit.
An illustration of the business unit listing is shown below.
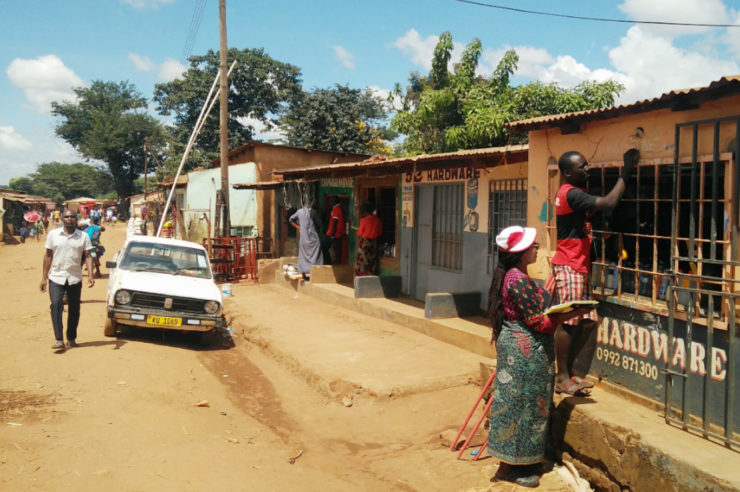
Figure 2: Listing of business units in an urban EA in Malawi.
This approach to MSME sampling allows a fairer representation of MSMEs and potentially improves the size estimation of the MSME sector. The model can be significantly improved if more geospatial data is more readily available. Satellite imaging is equally useful but very costly. Statistics bureaus and mapping tech organisations are collecting more and more GIS data which makes the mapping of businesses across a country much easier and readily available. This ensures that the model used for Malawi can be applied to other markets and significantly improved.
Technological improvements have significantly improved sampling methodologies, in this case the use of geospatial techniques, but the main limitation to this approach remains data availability, This is the case with Malawi. The probability of the EAs was based on potential to contain MSMEs and not the number of MSMEs, nor their size or formality. The availability of more data can only improve the accuracy of the sampling and sizing of the MSME sector. Despite this limitation, the new methodology allowed for higher proportion of MSMEs to be surveyed. Using number of employees and/or average annual turnover a total of 27,261 MSMEs were listed, with 147 medium and 3,892 small enterprises. This in itself, creates a database for further studies to be conducted on these business owners spanning from wholesale and trade, to tourism and agriculture.